Command-line tools
Most of the Linux distributions today come with a set of tools that monitor the system's performance. These tools help you measure and understand various subsystem statistics (CPU, memory, network, and so on). Let's look at some of the tools that are predominantly used.
-
ps/top: The process status command (ps) displays information about all the currently running processes in a Linux system. The top command is similar to thepscommand, but it periodically updates the information displayed until the program is terminated. An advanced version of top, calledhtop, has a more user-friendly interface and some additional features. These command-line utilities come with options to modify the operation and output of the command. Following are some important options supported by thepscommand.-
-p <pid1, pid2,...>: Displays information about processes that match the specified process IDs. Similarly, you can use-u <uid>and-g <gid>to display information about processes belonging to a specific user or group. -
-a: Displays information about other users' processes, as well as one's own. -
-x: When displaying processes matched by other options, includes processes that do not have a controlling terminal.
-
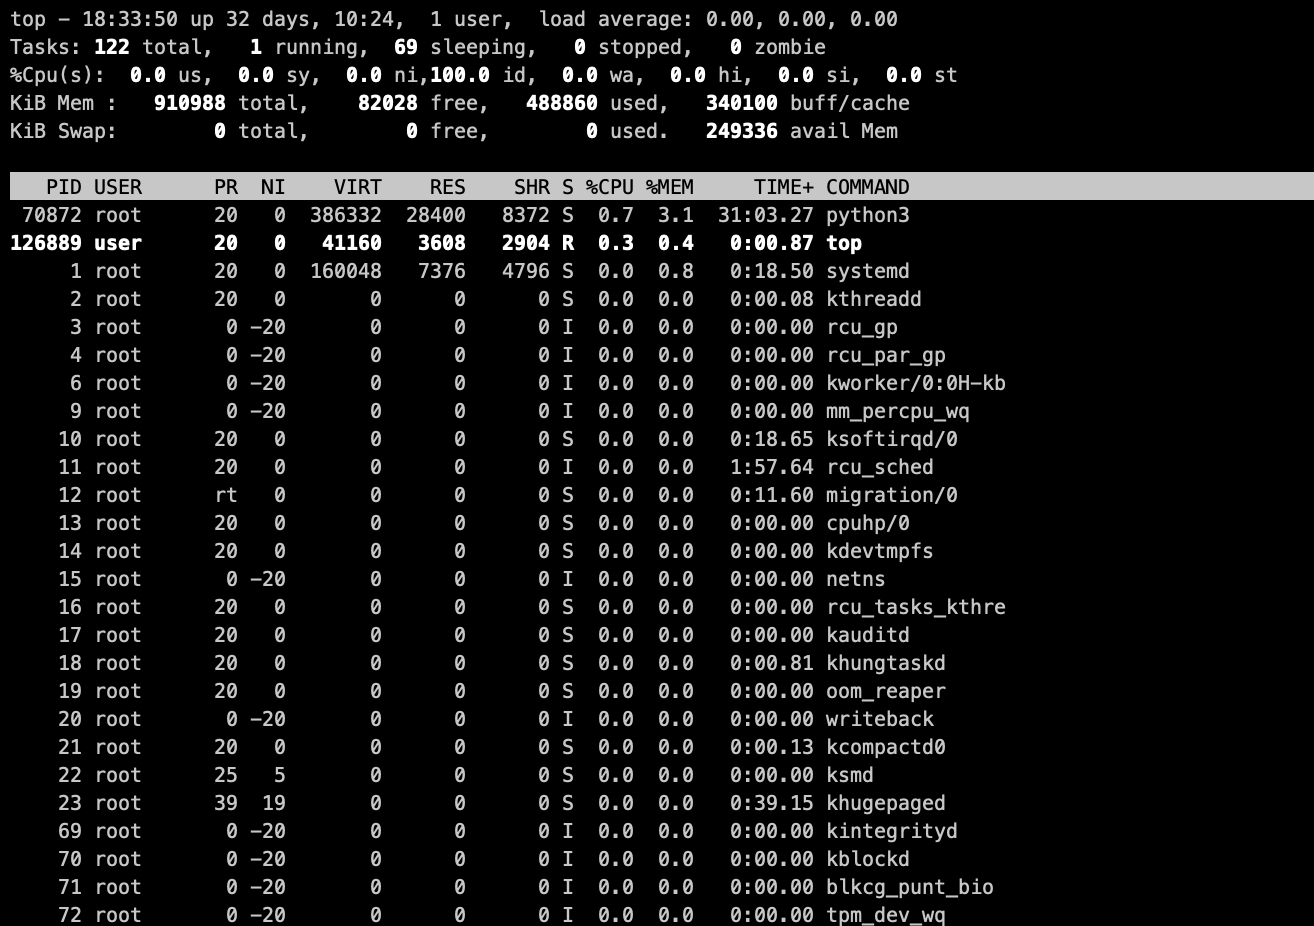
Figure 2: Results of top command
-
ss: The socket statistics command (ss) displays information about network sockets on the system. This tool is the successor of netstat, which is deprecated. Following are some command-line options supported by thesscommand:-
-t: Displays the TCP socket. Similarly,-udisplays UDP sockets,-xis for UNIX domain sockets, and so on. -
-l: Displays only listening sockets. -
-n: Instructs the command to not resolve service names. Instead displays the port numbers.
-
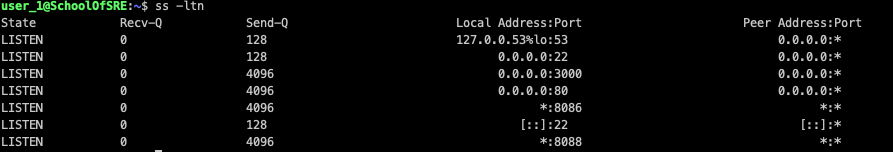
Figure 3: List of listening sockets on a system
free: Thefreecommand displays memory usage statistics on the host like available memory, used memory, and free memory. Most often, this command is used with the-hcommand-line option, which displays the statistics in a human-readable format.
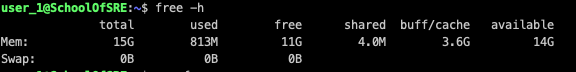
Figure 4: Memory statistics on a host in human-readable form
df: Thedfcommand displays disk space usage statistics. The-icommand-line option is also often used to display inode usage statistics. The-hcommand-line option is used for displaying statistics in a human-readable format.
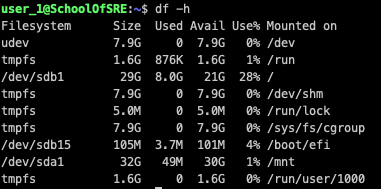
Figure 5: Disk usage statistics on a system in human-readable form
-
sar: Thesarutility monitors various subsystems, such as CPU and memory, in real time. This data can be stored in a file specified with the-ooption. This tool helps to identify anomalies. -
iftop: The interface top command (iftop) displays bandwidth utilization by a host on an interface. This command is often used to identify bandwidth usage by active connections. The-ioption specifies which network interface to watch.
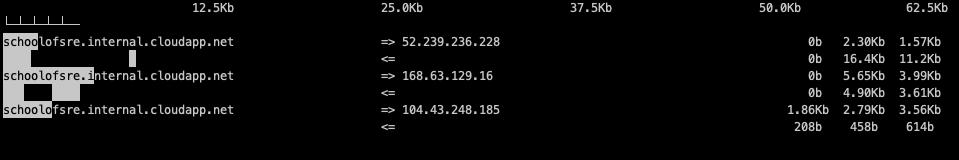
Figure 6: Network bandwidth usage by active connection on the host
-
tcpdump: Thetcpdumpcommand is a network monitoring tool that captures network packets flowing over the network and displays a description of the captured packets. The following options are available:-
-i <interface>: Interface to listen on -
host <IP/hostname>: Filters traffic going to or from the specified host -
src/dst: Displays one-way traffic from the source (src) or to the destination (dst) -
port <port number>: Filters traffic to or from a particular port
-
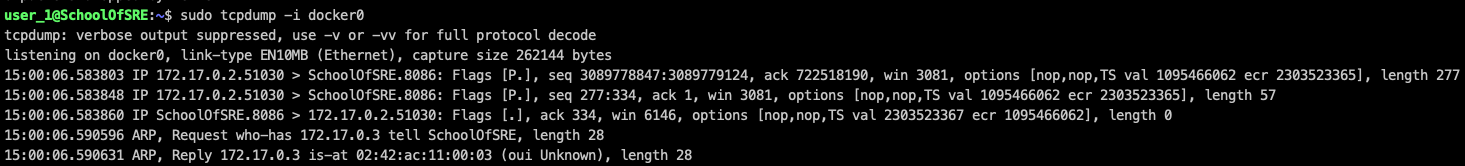
Figure 7: tcpdump of packets on docker0
interface on a host