Observability
Engineers often use observability when referring to building reliable systems. Observability is a term derived from control theory, It is a measure of how well internal states of a system can be inferred from knowledge of its external outputs. Service infrastructures used on a daily basis are becoming more and more complex; proactive monitoring alone is not sufficient to quickly resolve issues causing application failures. With monitoring, you can keep known past failures from recurring, but with a complex service architecture, many unknown factors can cause potential problems. To address such cases, you can make the service observable. An observable system provides highly granular insights into the implicit failure modes. In addition, an observable system furnishes ample context about its inner workings, which unlocks the ability to uncover deeper systemic issues.
Monitoring enables failure detection; observability helps in gaining a better understanding of the system. Among engineers, there is a common misconception that monitoring and observability are two different things. Actually, observability is the superset to monitoring; that is, monitoring improves service observability. The goal of observability is not only to detect problems, but also to understand where the issue is and what is causing it. In addition to metrics, observability has two more pillars: logs and traces, as shown in Figure 9. Although these three components do not make a system 100 percent observable, these are the most important and powerful components that give a better understanding of the system. Each of these pillars has its flaws, which are described in Three Pillars with Zero Answers.
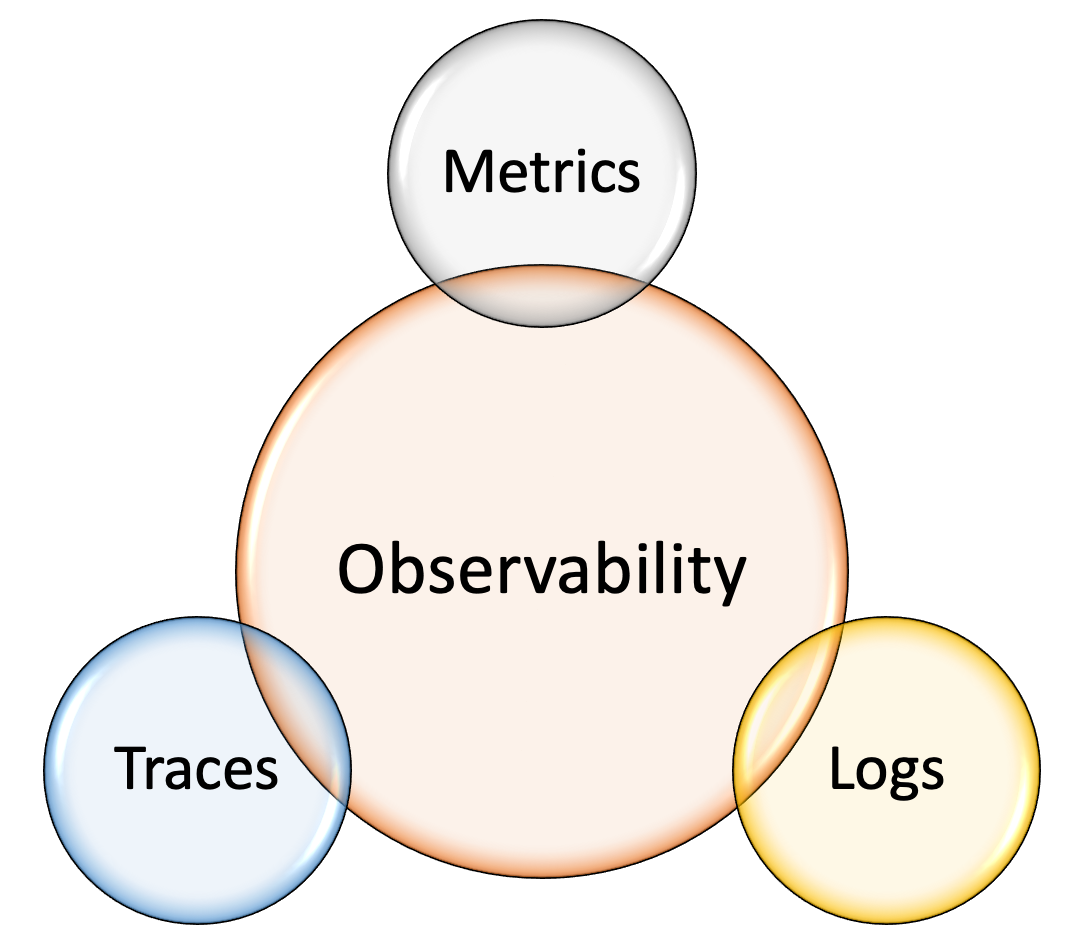
Figure 9: Three pillars of observability
Because we have covered metrics already, let's look at the other two pillars (logs and traces).
Logs
Logs (often referred to as events) are a record of activities performed by a service during its run time, with a corresponding timestamp. Metrics give abstract information about degradations in a system, and logs give a detailed view of what is causing these degradations. Logs created by the applications and infrastructure components help in effectively understanding the behavior of the system by providing details on application errors, exceptions, and event timelines. Logs help you to go back in time to understand the events that led to a failure. Therefore, examining logs is essential to troubleshooting system failures.
Log processing involves the aggregation of different logs from individual applications and their subsequent shipment to central storage. Moving logs to central storage helps to preserve the logs, in case the application instances are inaccessible, or the application crashes due to a failure. After the logs are available in a central place, you can analyze the logs to derive sensible information from them. For audit and compliance purposes, you archive these logs on the central storage for a certain period of time. Log analyzers fetch useful information from log lines, such as request user information, request URL (feature), and response headers (such as content length) and response time. This information is grouped based on these attributes and made available to you through a visualization tool for quick understanding.
You might be wondering how this log information helps. This information gives a holistic view of activities performed on all the involved entities. For example, let's say someone is performing a DoS (denial of service) attack on a web application. With the help of log processing, you can quickly look at top client IPs derived from access logs and identify where the attack is coming from.
Similarly, if a feature in an application is causing a high error rate when accessed with a particular request parameter value, the results of log analysis can help you to quickly identify the misbehaving parameter value and take further action.
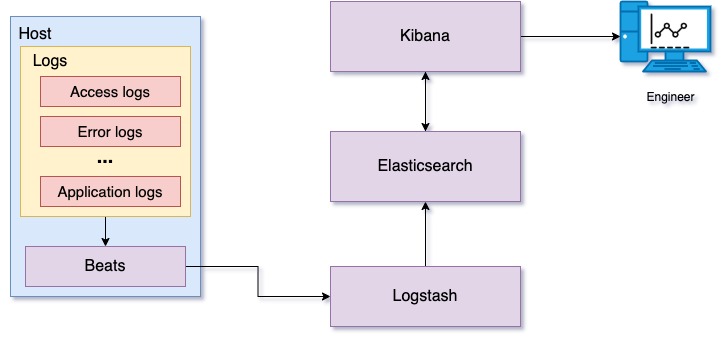
Figure 10: Log processing and analysis using ELK stack
Figure 10 shows a log processing platform using ELK (Elasticsearch, Logstash, Kibana), which provides centralized log processing. Beats is a collection of lightweight data shippers that can ship logs, audit data, network data, and so on over the network. In this use case specifically, we are using filebeat as a log shipper. Filebeat watches service log files and ships the log data to Logstash. Logstash parses these logs and transforms the data, preparing it to store on Elasticsearch. Transformed log data is stored on Elasticsearch and indexed for fast retrieval. Kibana searches and displays log data stored on Elasticsearch. Kibana also provides a set of visualizations for graphically displaying summaries derived from log data.
Storing logs is expensive. And extensive logging of every event on the server is costly and takes up more storage space. With an increasing number of services, this cost can increase proportionally to the number of services.
Tracing
So far, we covered the importance of metrics and logging. Metrics give an abstract overview of the system, and logging gives a record of events that occurred. Imagine a complex distributed system with multiple microservices, where a user request is processed by multiple microservices in the system. Metrics and logging give you some information about how these requests are being handled by the system, but they fail to provide detailed information across all the microservices and how they affect a particular client request. If a slow downstream microservice is leading to increased response times, you need to have detailed visibility across all involved microservices to identify such microservice. The answer to this need is a request tracing mechanism.
A trace is a series of spans, where each span is a record of events performed by different microservices to serve the client's request. In simple terms, a trace is a log of client-request serving derived from various microservices across different physical machines. Each span includes span metadata such as trace ID and span ID, and context, which includes information about transactions performed.
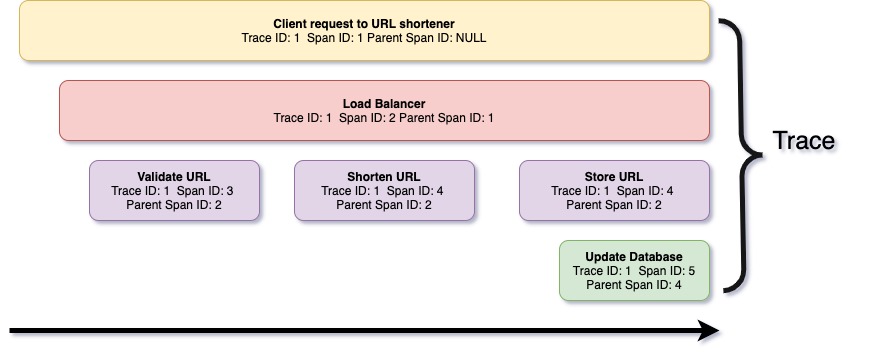
Figure 11: Trace and spans for a URL shortener request
Figure 11 is a graphical representation of a trace captured on the URL shortener example we covered earlier while learning Python.
Similar to monitoring, the tracing infrastructure comprises a few modules for collecting traces, storing them, and accessing them. Each microservice runs a tracing library that collects traces in the background, creates in-memory batches, and submits the tracing backend. The tracing backend normalizes received trace data and stores it on persistent storage. Tracing data comes from multiple different microservices; therefore, trace storage is often organized to store data incrementally and is indexed by trace identifier. This organization helps in the reconstruction of trace data and in visualization. Figure 12 illustrates the anatomy of the distributed system.
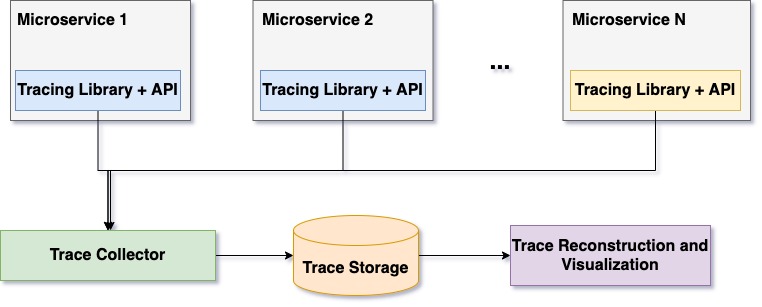
Figure 12: Anatomy of distributed tracing
Today a set of tools and frameworks are available for building distributed tracing solutions. Following are some of the popular tools:
-
OpenTelemetry: Observability framework for cloud-native software
-
Jaeger: Open-source distributed tracing solution
-
Zipkin: Open-source distributed tracing solution